Running the PyFibre GUI
Once installed, enter the PyFibre deployment environment using:
python -m ci shell
and call the executable PyFibre_GUI from the command line to initiate the graphical user interface.
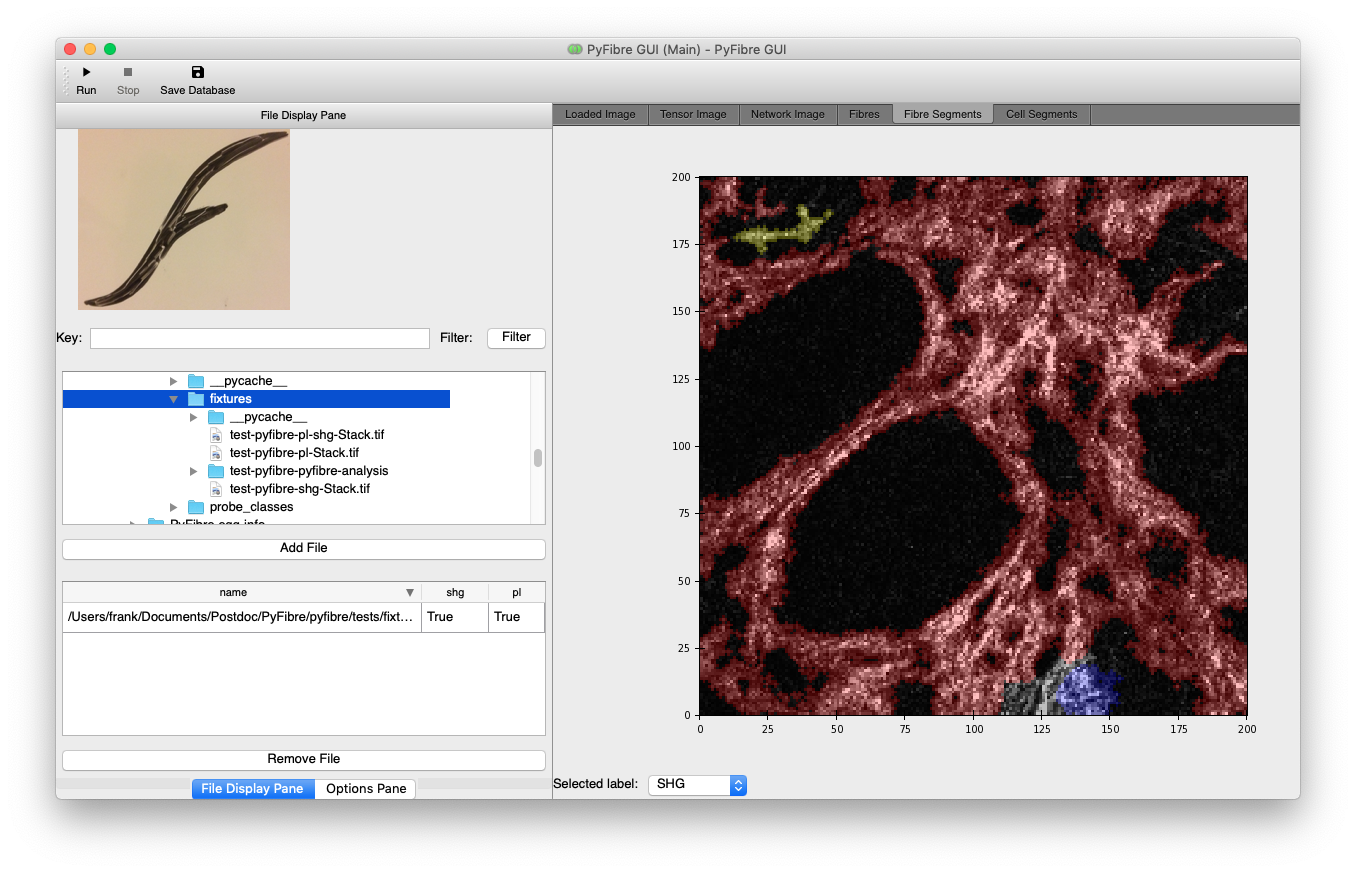
File Display Pane
The File Display Pane holds options for loading and organising image files for analysis
File Viewer
Here the user may select a single file or directory to load into the software. Currently PyFibre only supports TIFF
images and therefore these will only appear in the file tree under display. Upon pressing ‘Add Files’ , PyFibre will
attempt to create FileSet objects from the selection using every available BaseFileParser that has been
contributed and display these in the file management view.
File Management
Once loaded, the FileSet objects are visible in a scrollable list on the left hand side. A reference to the
file location and type of FileSet is provided. They can be removed from here at any time by highlighting and
clicking the ‘Delete’ button, or automatically filtered for keywords using the ‘Filter’ entry form.
Running Analysis
Clicking the ‘Run’ button at the bottom will begin a batch analysis of all the files listed within the box at the time of execution. This can be interrupted at any point using the ‘Stop’ button in the tool bar.
Options Tab
The Options Pane holds additional user options for the most common image analysis operations performed by the software.
Saving Databases
After analysis is complete, the ‘Save Database’ icon in the tool bar brings up a file window in which to save a collated copy of all loaded image metrics.
Image Viewer
The image display notebook on the right hand side of the GUI is able to show both the original images as well as
results of PyFibre’s analysis. These are organised into tabs, which are formatted by contributing FileDisplayTab
objects in plugins. Each BaseMultiImage object has a customisable view comprised of one or multiple tabs.
Currently SHG-PL-Trans images can be displayed with the following tabs:
Tab |
Description |
|---|---|
Loaded Image |
Grey-scale multi-channel image |
Tensor Image |
RGB multi-channel image, using hue, saturation and brightness based on pixel structure tensor |
Network |
Grey-scale multi-channel image with over-layed FIRE networks |
Fibre |
Grey-scale multi-channel image with over-layed individual fibres extracted from FIRE networks |
Fibre Segment |
Grey-scale multi-channel image with over-layed segmented regions base on position of FIRE networks |
Cell Segment |
Grey-scale multi-channel image with over-layed segmented regions base on position of cellular regions |